


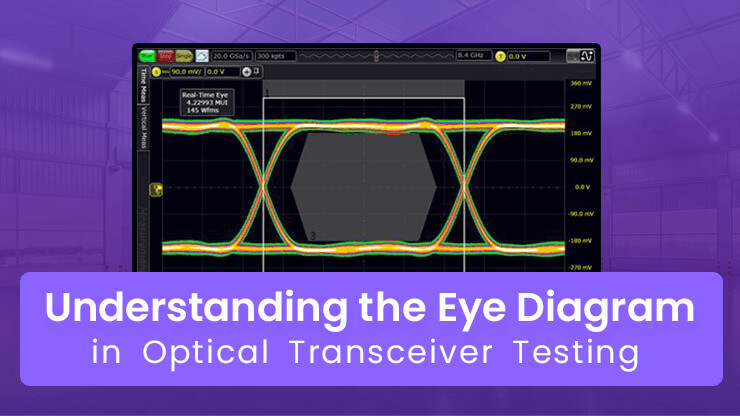
Understanding the Eye Diagram in Optical Transceiver Testing
In transceiver testing, the eye diagram is a critical indicator for evaluating transceiver quality. Whether its various parameters are within the normal range directly determines the performance of the transceiver. The key parameters used to judge whether an eye diagram is normal include eye height, eye width, jitter, and extinction ratio. The benchmark for determining whether an eye diagram passes the test is the eye mask. For beginners, this might sound confusing—but don’t worry. Today, let’s take a closer look at eye diagrams and their parameters to help you on the path to becoming a qualified engineer.
What Is an Eye Diagram?
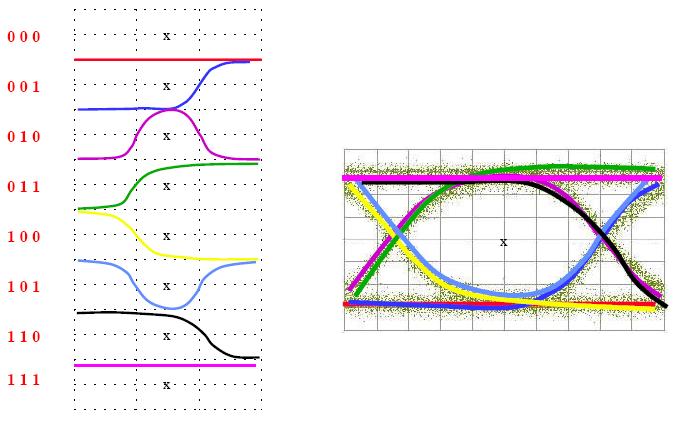
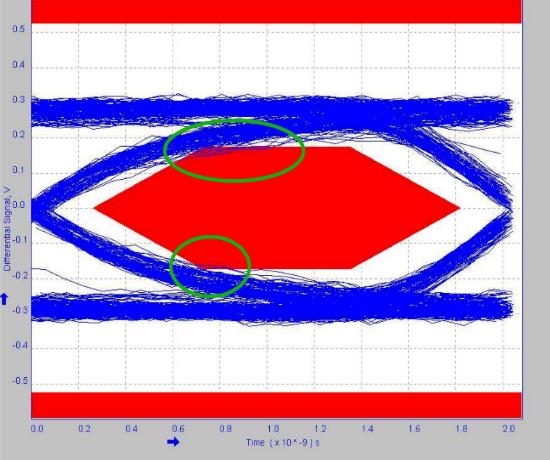
We all know that a transceiver transmits data information through optical signals. With the help of an oscilloscope, we can visually observe these optical signals. If we store each captured optical signal and display them in a persistence mode so that they accumulate and overlap, the combined data will form a pattern resembling an “eye” on the oscilloscope screen. This is what we commonly refer to as an eye diagram in transceiver testing. The eye diagram reflects the overall characteristics of all signals transmitted over the link, helping us assess the quality of the transceiver.
Eye Diagram Parameters
- Eye Height
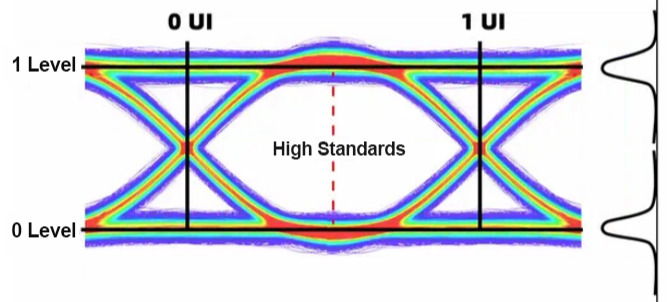
Eye height is the vertical distance between the upper and lower boundaries of the eye diagram. This parameter indicates the vertical margin between logic “1” and logic “0”, reflecting the noise tolerance of the transmitted optical signal. The larger the eye height, the more “open” the eye appears in the diagram, and the clearer the distinction between logic 1 and logic 0. This translates into stronger resistance to noise and interference. In transceiver testing, a higher eye height means that the “1” and “0” states are more distinguishable, the bit error rate (BER) is lower, and the overall quality of the transceiver is better. Typically, the eye height should be well above the system noise level, leaving sufficient margin to ensure accurate signal recognition.
- Eye Width
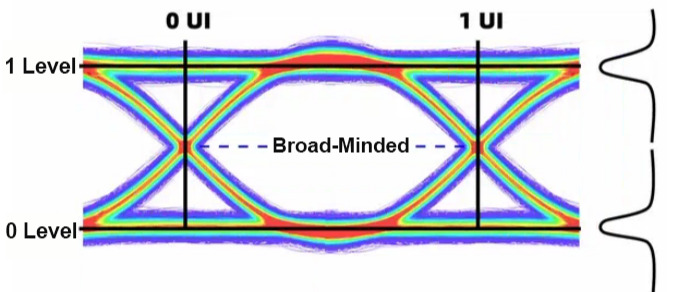
Eye Width is the horizontal distance between the two crossing points of the eye diagram, defined as the time difference between the points where the upper and lower edges intersect (Crossing Points). It represents the time window during which the signal remains in a valid state during transitions and reflects the total jitter of the signal. Generally, a larger eye width indicates greater timing margin, allowing better tolerance to jitter and timing variations. In practical transceiver testing, sufficient eye width enables the transceiver to sample the signal at the optimal moment, minimizing the risk of misreading and reducing bit errors. Typically, the eye width must meet the timing margin requirements for the specific data rate and system specifications.
- Crossing Point of the Eye
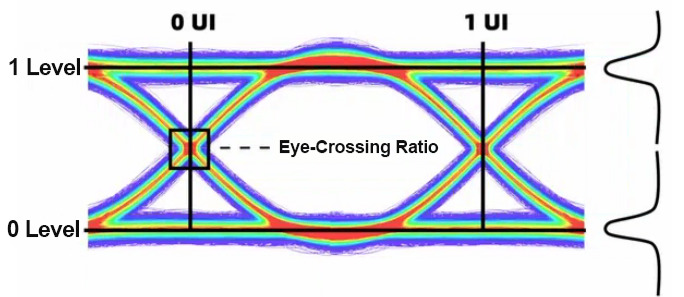
The term “eye diagram crossing point” is quite intuitive—it refers to where the “eyes” intersect, representing the temporal overlap of logic 0 and logic 1 signals. Its ratio reflects the signal’s duty cycle. In practice, however, the pulse width of the optical signal broadens during transmission, causing the crossing point on the receiving side to shift upward relative to the transmitting side. To facilitate long-distance transmission and ensure the receiving-side crossing point is around 50%—where receiver sensitivity is optimal—it is generally recommended in testing and production to slightly lower the crossing point on the transmitting side. Typically, the transmitting-side crossing point ratio is controlled at 40%–45%, so that after pulse broadening during transmission, the receiving-side crossing point ratio will be around 50%, ensuring optimal receiver sensitivity.
- Jitter
Jitter refers to the short-term timing variations that occur during signal transitions, caused by factors such as electromagnetic interference, power supply noise, and component tolerances. These timing deviations act as noise that can lead to bit errors. Excessive jitter makes signal transitions unpredictable, potentially causing errors. Jitter can be categorized into random jitter and deterministic jitter. Random jitter originates from stochastic processes like thermal noise, while deterministic jitter arises from identifiable causes such as inter-symbol interference (ISI) and crosstalk. Minimizing these types of jitter in a system is crucial for improving overall performance. Analyzing jitter and its sources helps designers mitigate its impact, assess its effect on the bit error rate (BER), and ensure that the system’s BER remains below a specified maximum threshold.
- Mask Margin
The eye diagram mask is created by first defining the standard requirements and turning them into a template that outlines the acceptable boundaries for signal amplitude and timing characteristics. By loading this template on an oscilloscope, one can directly observe whether the eye diagram touches the mask. Here, it’s important to mention the eye diagram mask margin. The mask margin is a comprehensive indicator used to assess whether an eye diagram meets industry standards. It represents how much the mask edges can be expanded before intersecting with the actual eye diagram. In other words, it shows how much leeway the signal has to vary while still remaining within the specified limits. A larger mask margin indicates that the signal can tolerate greater variations and still comply with the required specifications, reflecting better and more standard-compliant signal quality.
The Importance of Eye Diagrams in Transceiver Testing
Eye diagrams are an essential tool for evaluating and optimizing the performance of optical transceivers, widely used to analyze the quality of electrical-to-optical signal conversion. In practical applications, transceivers often face various challenges such as dispersion, polarization mode dispersion(PMD), and noise, all of which can significantly affect signal integrity and transmission quality. Through eye diagram analysis, test engineers and R&D personnel can gain an intuitive understanding of the overall performance of a transceiver, enabling targeted adjustments and optimizations to ensure compliance with relevant standards and application requirements. Therefore, eye diagrams play an indispensable role in the testing and validation of optical modules.
Conclusion
With the continuous advancement of optical communication technology and the ongoing increase in data transmission rates, ensuring signal integrity and system stability has become increasingly critical. As a key tool for evaluating high-speed signal quality, eye diagram test has become ever more valuable in design validation, troubleshooting, and mass production testing. Whether for experienced engineers or newcomers to the field, mastering the basic principles of eye diagram analysis and its key parameters is a crucial step toward deeply understanding transceiver operation, enhancing system reliability, and optimizing product performance. We hope this brief introduction provides useful guidance for your work or studies in optical communications. LSOLINK will continue to offer professional and efficient optical communication solutions.
Share on Social:


